
Main Dashboard View
Overview Panel

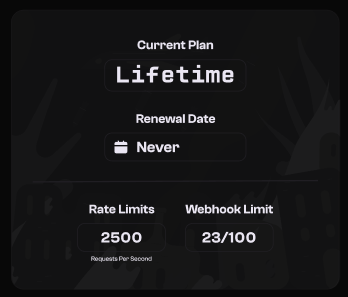
When you log into the dashboard, the top section gives you a high-level overview of your current access and usage.
You’ll see your active plan (such as Free, Lifetime, or Premium), along with your renewal or expiration date. Next to that, the system shows your current request-per-second (RPS) limit and webhook slot usage. This helps you monitor your active resources at a glance.
If you’re close to a limit or need to renew access, this section will provide visual indicators or action prompts.
Quick Navigation Cards

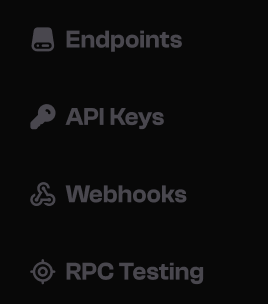
Below the overview panel, you’ll find a set of navigation cards. These act as shortcuts to the core tools in the dashboard. Each card links directly to a key module:
- Endpoints – View or manage your RPC and Router URLs
- API Keys – Create, copy, or rotate API keys
- Webhooks – Add listeners and configure triggers
- Whitelist / Blacklist – Set domain and IP access rules
- RPC Testing – Launch the in-browser utility to test endpoint speed and availability
These cards make it easy to move through the dashboard without needing to dig through menus.
Updated 9 months ago